Are you tired of inconsistent trading results? Do you feel like you’re guessing more than strategizing? Many traders struggle because they don’t fully grasp the core mathematical principles that underpin long-term profitability. Understanding your Risk-to-Reward Ratio (ARR), Win Rate (WR), and overall Trading Expectancy isn’t just for quants – it’s essential for every trader.
Today, we’re not only going to demystify these concepts but also provide you with a powerful Trading Risk Assessment Calculator (embedded below!) to bring these numbers to life for your own strategy.
Trading Risk Assessment Calculator
Input Parameters
Results
Average Risk to Reward Reference Table
| Avg Loss | Avg Gain | Average RR | Win Rate to Breakeven |
|---|---|---|---|
| 5 | 1 | 0.20 | 83% |
| 4 | 1 | 0.25 | 80% |
| 3 | 1 | 0.33 | 75% |
| 2 | 1 | 0.50 | 67% |
| 1 | 1 | 1.00 | 50% |
| 1 | 2 | 2.00 | 33% |
| 1 | 3 | 3.00 | 25% |
| 1 | 4 | 4.00 | 20% |
| 1 | 5 | 5.00 | 17% |
How to Use the Calculator: A Step-by-Step Guide
- Capital: Enter your total trading capital.
- Risk Per Trade %: Input the percentage of your capital you are willing to risk on a single trade (e.g., 0.5 for 0.5%, 1 for 1%, 0.75 for 0.75%).
- Average RR (Risk-to-Reward): Enter your target or historical average reward multiple compared to your risk. For example, if you aim to make 2 times your risk, enter
2.0. - Win Rate %: Enter your historical or anticipated percentage of winning trades (e.g., 40 for 40%).
- No. of Trades (Quarterly): Enter the total number of trades you expect to take in a quarter.
Understanding the Output:
- Capital: Your starting capital, as entered.
- Risk Per Trade %: The RPT% you entered, displayed for clarity.
- Avg. Loss per Trade: The actual monetary amount you’d lose per trade based on your capital and RPT%.
- Average Risk to Reward: The ARR you entered.
- Avg. Gain per Trade: The actual monetary amount you’d gain on an average winning trade.
- No. of Trades (Quarterly): The number of trades you entered.
- Win Rate: The win rate you entered.
- Winning/Losing Trades (Quarterly): The calculated number of winning and losing trades for the quarter.
- Profit in Winning Trades / Loss in Losing Trades (Qtly): Total monetary gain from winners and total loss from losers over the quarter.
- Quarterly Return: The net profit or loss in monetary terms for the quarter.
- Quarterly Return %: Your net profit or loss expressed as a percentage of your initial capital for the quarter.
- Annual Return % (Compounded): This is a powerful one! It projects your annual return by compounding your quarterly return percentage. This shows the potential power of consistent, positive expectancy trading.
Don’t forget to check the Average Risk to Reward Reference Table the main results. It highlights the row corresponding to your input ARR and shows the breakeven win rate for different ARR levels.
Benefits of Using This Calculator & Understanding These Metrics
- Informed Decision-Making: Stop trading blindly. Make decisions based on data.
- Strategy Refinement: Identify weaknesses. Is your ARR too low? Is your Win Rate suffering?
- Realistic Expectations: Understand what’s mathematically possible with your current approach.
- Improved Risk Management: Clearly see the impact of your RPT% and how it scales with your expectancy.
- Increased Confidence: Trading with a statistically validated edge builds confidence and discipline.
Key Takeaways for Trading Success
- No Holy Grail: No single metric guarantees success. It’s the interplay of ARR, WR, and controlled risk that matters.
- Positive Expectancy is King: Your primary goal should be to develop and trade a strategy with a positive expectancy.
- Risk Management is Non-Negotiable: Even with a great strategy, poor risk management (e.g., risking too much per trade) can lead to ruin.
- Consistency Over Time: Focus on executing your positive expectancy strategy consistently. The power of compounding (as seen in the “Annual Return %”) works wonders over time.
- Continuous Learning: The market evolves, and so should you. Regularly review your metrics and adapt.
We hope this explanation and the Trading Risk Assessment Calculator empower you to take your trading to the next level. Play around with the numbers, see how different scenarios impact your potential outcomes, and start building a more robust, data-driven trading approach.
What is This Calculator For?
This interactive tool is designed to help you:
- Objectively Assess Your Strategy: Move beyond gut feelings and see the numbers.
- Understand Potential Profitability: Project quarterly and annual returns based on your current metrics.
- Refine Your Risk Management: See how small changes in risk per trade or win rate can impact your bottom line.
- Make Informed Decisions: Know if your strategy has a positive expectancy before you risk more capital.
Let’s dive into the key metrics the calculator uses.
Core Pillar 1: Average Risk-to-Reward Ratio (ARR)
The Average Risk-to-Reward Ratio (ARR) is a cornerstone of successful trading. It simply measures how much your average winning trade makes compared to your average losing trade.
Formula:ARR = Average Gain per Trade / Average Loss per Trade
- Average Loss: Typically, this is determined by your stop-loss strategy. If you risk 1% of your capital per trade, and your capital is $10,000, your average intended loss is $100.
- Average Gain: This is the average profit you make on your winning trades.
Why it Matters:
A higher ARR is generally desirable (e.g., 2:1, 3:1, or more). It means your winners are significantly larger than your losers. This gives you a buffer; you don’t need to win a high percentage of your trades to be profitable if your winners are big enough. For instance, with an ARR of 3:1, you could theoretically win only 3 out of 10 trades and still be profitable (excluding commissions/slippage).
Our calculator will show you the ARR based on your “Risk Per Trade %” and your “Average RR” input (where ARR is directly what you input as “Average RR” if you’re defining how much you target to make relative to your risk).
Core Pillar 2: Win Rate (WR)
Your Win Rate (WR) is the percentage of your total trades that end up being profitable.
Formula:Win Rate % = (Number of Winning Trades / Total Number of Trades) * 100
Example: If you make 100 trades in a quarter and 45 of them are winners, your win rate is 45%.
Why it Matters:
While a higher win rate seems obviously good, it’s crucial to understand it in conjunction with your ARR. A high win rate with a poor ARR (e.g., winners are much smaller than losers) can still lead to losses. Conversely, a lower win rate can be very profitable if coupled with a strong ARR.
The Power Couple: ARR and Win Rate Determine Your Expectancy
Neither ARR nor WR tells the whole story in isolation. Their combined effect determines your trading Expectancy – essentially, what you can expect to make (or lose) on average per trade over the long run.
A Positive Expectancy strategy is one that, over many trades, is mathematically likely to generate profits. A Negative Expectancy strategy will likely lose money over time.
The Breakeven Point:
Understanding the breakeven point is vital. This is the win rate required to neither make nor lose money for a given ARR.
- If ARR is 1:1 (you make $1 for every $1 risked), you need a Win Rate > 50% to be profitable.
- If ARR is 2:1 (you make $2 for every $1 risked), you need a Win Rate > 33.33% to be profitable.
- (Calculation:
1 / (1 + ARR)gives the loss rate needed to breakeven, so1 - (1 / (1 + ARR))is the win rate for breakeven).
- (Calculation:
- If ARR is 3:1 (you make $3 for every $1 risked), you need a Win Rate > 25% to be profitable.
The calculator demonstrates this: input an ARR of 2 and a Win Rate of 40%. You’ll see a “Quarterly Return %” of 24% (if RPT is 1% and 120 trades). This is a positive expectancy! If you drop the Win Rate to 33% with the same ARR, your return hovers near zero.
Intensity Metrics: Scaling Your Results
Once you have a positive expectancy (your “edge”), Intensity Metrics determine the magnitude of your profits (or losses, if you have a negative expectancy).
The two primary intensity metrics are:
- Risk Per Trade (RPT %): The percentage of your capital you risk on any single trade.
- Number of Trades: How frequently you execute your strategy.
Why They Matter:
- Positive Expectancy Scenario: Increasing your RPT% (sensibly!) or taking more trades (if your strategy allows) will amplify your profits.
- Negative Expectancy Scenario: Increasing RPT% or trade frequency will unfortunately amplify your losses. This is why confirming positive expectancy first is crucial.
The calculator allows you to adjust these (“Risk Per Trade %” and “No. of Trades (Quarterly)”) to see their direct impact on your potential returns.
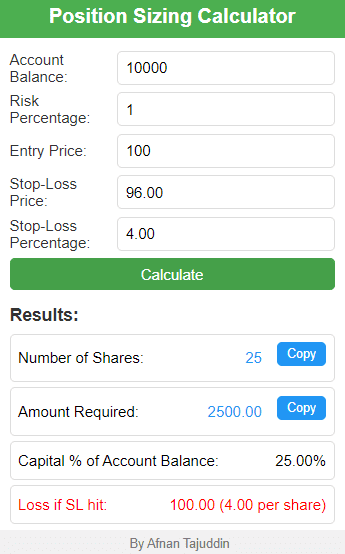
A Quick Note on Position Sizing
While our calculator focuses on overall risk and return metrics, these feed directly into how you should calculate your Position Size for each trade. A common formula is:
Position Size (in units of asset) = (Account Value * RPT%) / (Stop Loss % * Price per Unit)
Or, more simply related to the risk amount:Amount to Risk per Trade = Account Value * RPT%
Then, your actual position size depends on how far away your stop loss is in percentage or dollar terms from your entry.
What are your thoughts? Do you track these metrics in your trading? Share your experiences or questions in the comments below!