
Feeling uncertain about where to enter or exit, leading to analysis paralysis or impulsive decisions.
Spending countless hours manually drawing zones and scanning charts, often missing key setups.
Relying on indicators that signal *after* the move, hurting your risk-to-reward ratio.
Consistently identify optimal entry and exit points for greater profitability.
Spot crucial turning points in the market before they become obvious.
Quickly recognize areas of strong momentum to ride prevailing trends.
Automate your zone analysis, freeing up time to focus on executing profitable trades.
Leverage multi-timeframe analysis to refine entry and exit points with greater precision.
Align your trades with the actions of institutional investors for a strategic advantage.
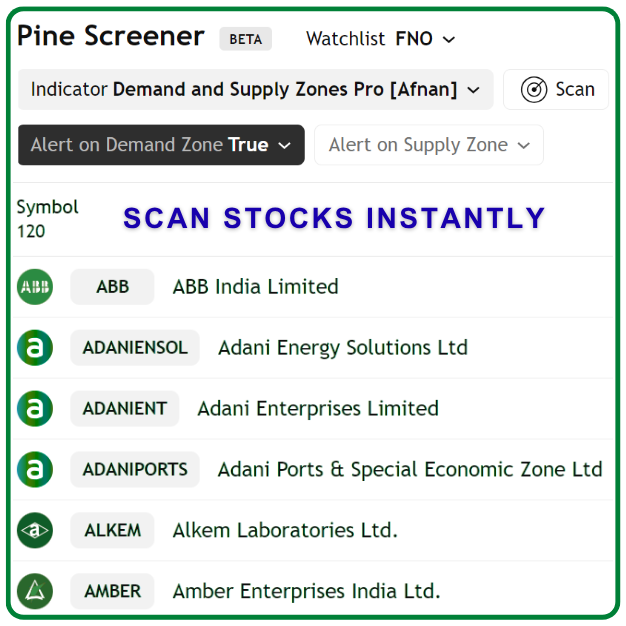
Using Pine Screener Scan watchlists across timeframes for high-probability setups, automating analysis and saving time.
Receive real-time alerts for zone interactions, ensuring you never miss a trading opportunity.
Visualize higher timeframe zones on your current chart for multi-timeframe confluence and a stronger trading edge.
Automate higher timeframe curve analysis on trading timeframe to understand Price location, aiding precise Location assessment.
Plot only key, significant zones to filter market noise and ensure genuine institutional activity.
Validate zone performance by identifying strong follow-through moves, candle sensitivity indicating institutional interest and boosting confidence.
Choose to display or hide previously violated zones for a cleaner chart while retaining historical insights.
Visually identify historical reactions to zones by toggling their display, understanding past validity.
View trends from two timeframes simultaneously for alignment with dominant market momentum and broader context.
Personalize all zone and chart colors to seamlessly match your TradingView theme and preferences.
Customize zone plotting using candle bodies or wicks for flexible analysis.
Highlight invisible candles for advanced analysis, uncovering hidden market clues not visible with conventional candles.
Our indicator automatically analyzes and shows you where Smart Money is active, eliminating manual drawing.
From automatic zone plotting to advanced watchlist screening – everything you need in one powerful tool.
Benefit from indicators created by experienced, successful traders who understand the market.
Access professional-grade trading tools at competitive prices, making advanced analysis accessible.
Our indicator helps you align your trades with market movers, giving you an undeniable edge.
Our leading indicator tracks Price Action, unlike lagging conventional indicators that rely on mathematical conditions.
The power of volume and how to read it!
— TradingView (@tradingview) July 10, 2023
Written by AfnanTAjuddinhttps://t.co/DowJPL4AhY
Try the Demand & Supply Zones Pro Indicator with full access for 8 days. If it’s not the edge you’re looking for, simply cancel anytime — no charges, no questions asked.

Extremely impressed with how the indicator picks up the zones. By far the best supply demand indicator on tradingview
Your TradingView username is in your profile settings. It’s the unique ID you use on the platform, not your name or email. Learn how to find your TradingView username here.
If you want to understand how to use our indicator, watch the tutorial videos available on YouTube. Here’s the playlist link to help you get started.
If you are an existing client and want to manage your subscription (modify details or cancel your plan), you can do so by visiting the customer portal. Enter your registered email here: Customer Portal.